Description:
The challenge provides you with two rather large example zip files, one with example data and one with the real data for the flag. The challenge states:
Your rival seems has been tracking satellites with a hobbiest antenna, and it’s causing a lot of noise on my ground lines. Help me figure out what he’s tracking so I can see what she’s tracking
(Errors appeared in the original)
The useful details are in the example zip’s READMEs.
RF background
In this challenge we receive traces of RF signals captured from two separate PWM signals controlling motors that point antennas at satellites. A PWM signal is simply a square wave that has a fixed frequency for its rising edge and its duty-cycle determines the falling edge. The duty cycle is typically expressed as a percent, and represents the amount of time in each period that the signal is high. A good visualization of this is available here.
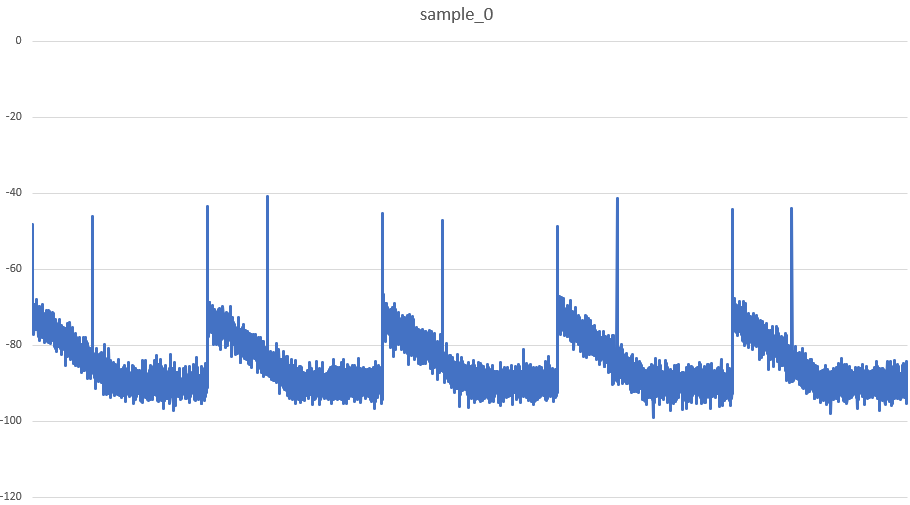
When we plot these RF signal values we can see that there is a repeating pattern: there is a peak, followed by some decreasing noise and then another spike. Whats important to recognize is that when a PWM signal changes states, from low to high or high to low, that is a rapid change in current. And according to electromagnetism, this results in a change in magnetic field, which causes EM waves: our RF signals! The repetitions should correspond to the frequency and each spike would be a rising or falling edge.
Solving
This challenge is reminiscent of other power analysis challenges, but I found that most of those were not well suited to be easily adapted to this challenge. We should be able to map the RF signals we have to PWM and from that we can use this detail in the README to figure out where the antennas were pointed:
We believe the azimuth and elevation motors of each antenna are controlled the same way as the earlier groundstation we compromised, using a PWM signal that varies between 5% and 35% duty cycle to move one axis from 0 degrees to 180 degrees.
I originally interpreted this to mean, “the duty cycle determines how fast the motors move, and we can correlate the duty cycles to the speed at which a satellite crosses the field of view of the ground station”. I implemented this and had no luck correlating with the example data. I learned from my teammates that in some motors, the PWM directly controls the position of the motor, which was the correct way to think about this.
From here we can do the following: calculate the time between each peak, determine the period and calculate a duty cycle. If we get values between 5 and 35% we’re probably on the right track.
# find_peaks is a bit overkill in this case, but I didn't
# know at the time that the peaks were single points
# height was determined by looking at the data in Excel
peaks = scipy.signal.find_peaks(az, height=-60.0)
# I needed to insert the first value, since find_peaks would skip it
peak_indices = np.insert(peaks[0],0,[0])

# Get the duty cycle of the first pair
start_duty_az = (peak_indices[1] - peak_indices[0])/2048
# and of the last pair for the azimuth signal
end_duty_az = (peak_indices[-1] - peak_indices[-2])/2048

# And do it again for the elevation
start_duty_el = (peak_indices[1] - peak_indices[0])/2048
end_duty_el = (peak_indices[-1] - peak_indices[-2])/2048
This gave me duty cycle percentages that were within our range, so things are looking good. Now, the ground station could have been offset, so my thinking was that if we calculate the deltas, the math would cancel out the offsets if we look at the corresponding deltas of the satellites. We know that there is a 30% range of duty cycles for the motors which correspond to 180 degrees of motion, so we need to multiply our duty cycles by 60 to get degrees.
We used PyEphem to calculate the angles needed to look at the satellites from a given location at a given time.
with open("active.txt", "r") as f:
tle_data = f.read().split("\n")
for i in range(int(len(tle_data)/3)):
sat = ephem.readtle(tle_data[i*3], tle_data[i*3+1], tle_data[i*3+2])
sats[tle_data[i*3].strip()] = sat
base = ephem.Observer()
# These were from our examples
base.lat = ephem.degree * 32.4907
base.lon = ephem.degree * 45.8304
START_TIME = ephem.Date('2020-04-07 08:57:43.726371')
From here we can simply compare the deltas of the azimuth and elevation with the expected values from each satellite in the list and find a threshold in the sample data that only returns the correct results.
a_factor = 180/30

for fname in duties.keys():
    for sat_name, sat in sats.items():
        sat = sats[sat_name]

        base.date = START_TIME
        sat.compute(base)
        start_az = sat.az/ephem.degree
        start_el = sat.alt/ephem.degree

        base.date = START_TIME + 120 * ephem.second
        sat.compute(base)
        end_az = sat.az/ephem.degree
        end_el = sat.alt/ephem.degree

        predicted_start_az = a_factor * (duties[fname][0][0]-5)
        predicted_end_az = a_factor * (duties[fname][0][1]-5)
        predicted_start_el = a_factor * (duties[fname][1][0]-5)
        predicted_end_el = a_factor * (duties[fname][1][1]-5)

        pred_del_az = abs(predicted_end_az-predicted_start_az)
        del_az = abs(end_az-start_az)
        pred_del_el = abs(predicted_end_el-predicted_start_el)
        del_el = abs(end_el-start_el)

        # Determined reasonable error limit from samples
        if abs(pred_del_az - del_az) < 2 and abs(pred_del_el - del_el) < 2 :
            print(sat_name)
Extra notes
We had a sample satellite named SORTIE that causes the ground station to flip its azimuth and elevation over one of the 180 degree points, which did not want to correlate. If you looked at a graph of the duty cycles for azimuth, it looks like this:
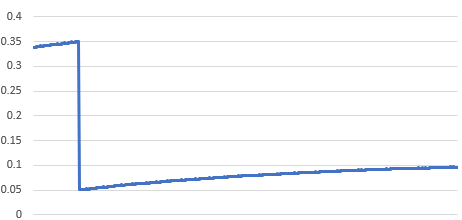
But in the real data used for the flag no such discontinuity existed, so we could just ignore this case. In order to get around this issue we could have simply skipped the section before the discontinuity.
In the end we did also find one other gotcha: because we had the “real” time in a different format we had to specify the timezone because Python used the locale’s timezone instead of GMT.